内存优化#
Backtrader 的开发是在拥有大量RAM的机器上进行的,加上绘图的可视化反馈非常有用,几乎是必需品,这使得设计决策变得容易:将所有内容保存在内存中。但这一决定有一些缺点:
- 使用
array.array进行数据存储时,当某些边界被超出时,需要分配和移动数据。 - 内存较少的机器可能会受到影响。
- 连接到一个可能在线数周/数月、提供数千秒/分钟分辨率tick的实时数据源。
后者比前者更重要,因为backtrader做出了另一个设计决策:
- 保持纯Python以便在需要时能够在嵌入式系统中运行。
未来的一个场景可能是backtrader连接到第二台提供实时数据的机器,而backtrader本身运行在Raspberry Pi甚至更有限的设备上,如ADSL路由器(带有Freetz映像的AVM Frit!Box 7490)。
因此,需要backtrader支持动态内存方案。现在可以使用以下语义实例化或运行Cerebro:
exactbars 默认值为 False,每个存储在线中的值都保存在内存中。可能的值:
True或1:所有“线”对象将内存使用减少到自动计算的最小周期。- 如果 SMA 的周期为30,则底层将始终有一个30条的运行缓冲区,以允许计算 SMA。
- 此设置将停用预加载和runonce。
- 使用此设置还将停用绘图。
-1:在策略级别的数据源和指标/操作将保留所有数据在内存中。- 如 RSI 内部使用指标UpDay进行计算。此子指标将不保留所有数据在内存中。
- 这允许保持绘图和预加载活动。
- runonce将被停用。
-2:作为策略属性的数据源和指标将保留所有点在内存中。- 如 RSI 内部使用指标UpDay进行计算。此子指标将不保留所有数据在内存中。
- 如果在
__init__中定义了a = self.data.close - self.data.high,那么a将不保留所有数据在内存中。 - 这允许保持绘图和预加载活动。
- runonce将被停用。
正如往常,示例胜过千言万语。一个示例脚本展示了差异。它针对1996年至2015年的雅虎每日数据运行,共计4965天。
注意:这是一个小样本。交易14小时的EuroStoxx50期货在一个月内将生成约18000个1分钟条。
首先执行脚本,查看在不请求内存节省时使用了多少内存位置:
$ ./memory-savings.py --save 0
Total memory cells used: 506430
对于级别1(完全节省):
$ ./memory-savings.py --save 1
Total memory cells used: 2041
从 50 万降到 2041。确实如此。
系统中的每个“线”对象使用collections.deque作为缓冲区(而不是array.array),并且长度限制为所需操作的绝对最小值。
假设,使用周期为30的简单移动平均线的策略。在这种情况下,将进行以下调整:
- 数据源将有一个30位置的缓冲区,这是 SMA 生成下一个值所需的数量。
- SMA 将有一个位置的缓冲区,因为除非其他指标需要(依赖于 SMA),否则没必要保留更大缓冲区。
注意:此模式最吸引人且可能最重要的特点是,整个脚本生命周期内使用的内存量保持不变。
无论数据源的大小如何。如如果长时间连接实时数据源,这将非常有用。
但请注意:
- 绘图不可用。
- 还有其他内存消耗源,如策略生成的订单,随着时间的推移会积累。
- 此模式只能与
runonce=False一起在cerebro中使用。这对于实时数据源也是强制性的,但在简单回测的情况下,这比runonce=True慢。毫无疑问,从某个折衷点来看,内存管理比逐步执行回测更昂贵,但这只能由平台的终端用户根据具体情况判断。
现在是负级别。这些旨在在保持绘图可用的同时仍节省大量内存。第一个级别-1:
$ ./memory-savings.py --save -1
Total memory cells used: 184623
在这种情况下,1 级指标(策略中声明的那些)保留其完整长度缓冲区。但如果这些指标依赖于其他指标(这是情况),则子对象将长度受限。在这种情况下,我们从:
- 506430内存位置降至 -> 184623
超过50%的节省。
注意:当然,array.array对象已被collections.deque替换,后者在内存方面更昂贵,虽然在操作方面更快。但collections.deque对象相当小,节省的内存位置接近大致计算的内存位置使用。
现在是级别-2,这也是为了节省在策略级别声明且标记为不绘图的指标:
$ ./memory-savings.py --save -2
Total memory cells used: 174695现在并没有节省多少。这是因为只有一个指标被标记为不绘图:TestInd().plotinfo.plot = False。
让我们看看最后一个示例的绘图:
$ ./memory-savings.py --save -2 --plot
Total memory cells used: 174695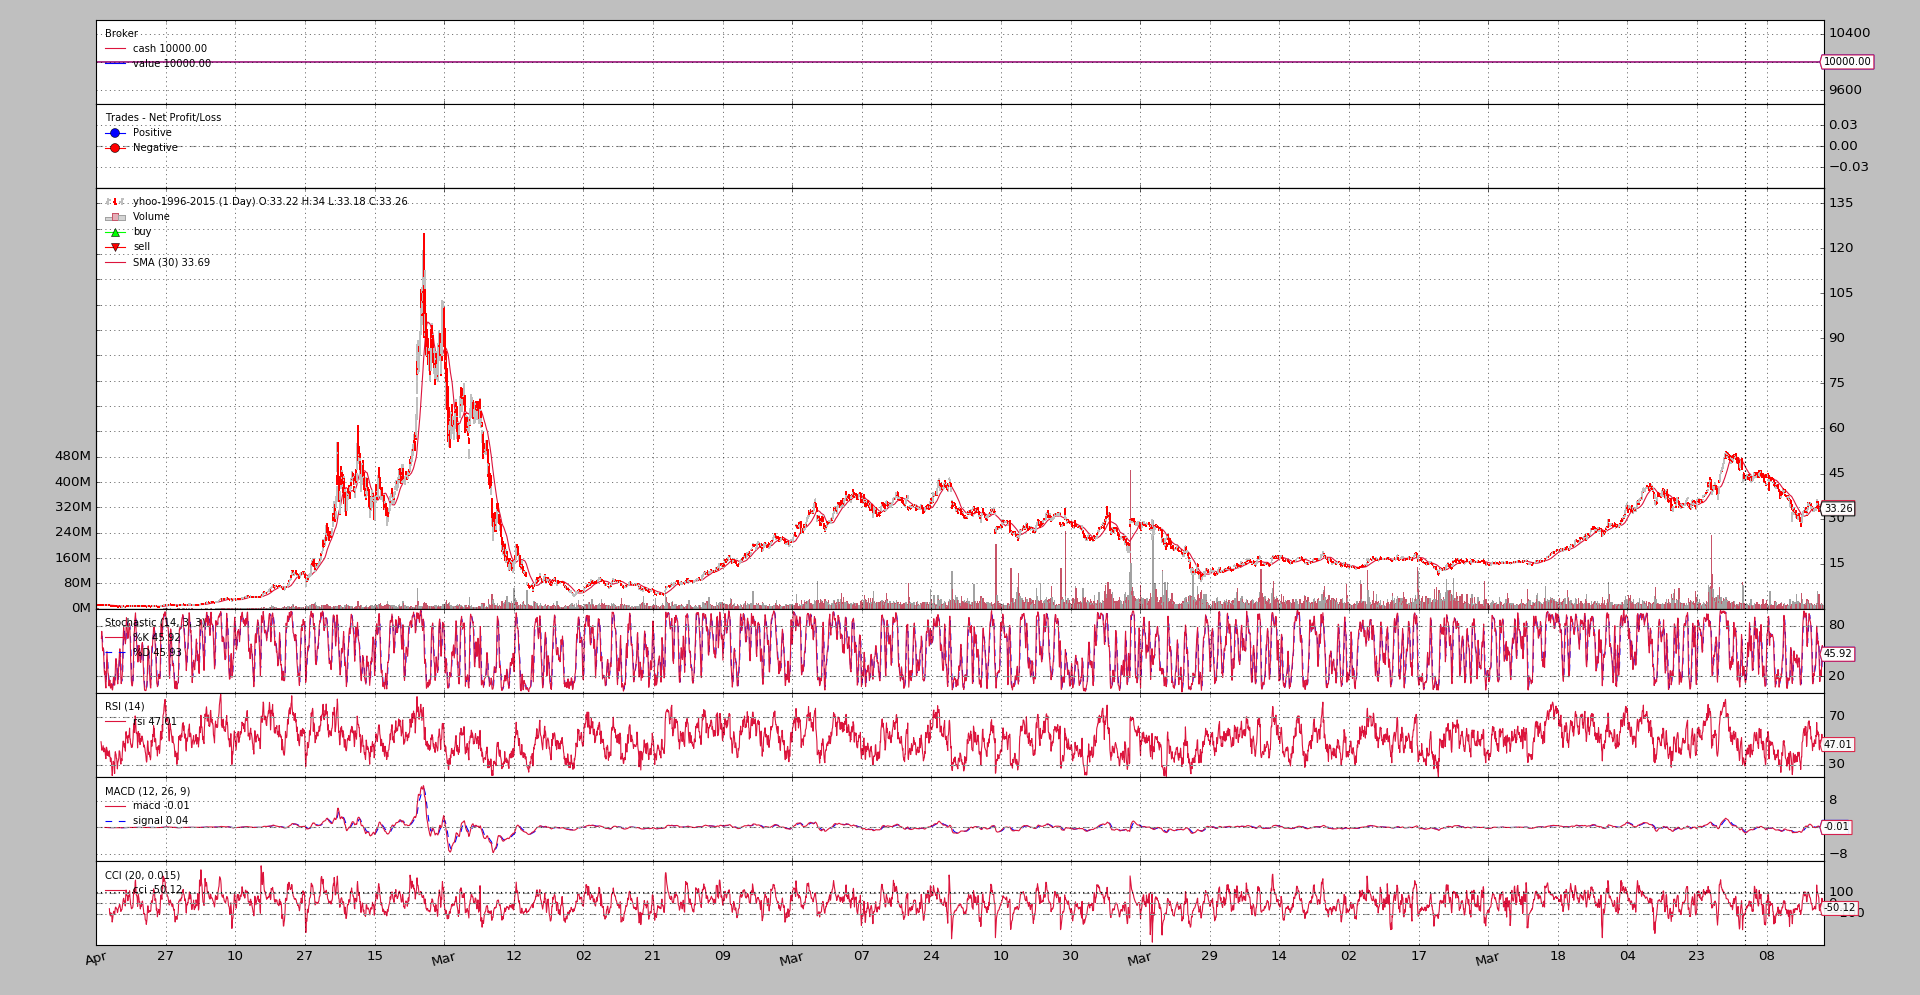
对于感兴趣的读者,示例脚本可以详细分析遍历指标层次结构的每个“线”对象。启用绘图运行(在-1保存):
$ ./memory-savings.py --save -1 --lendetails
-- Evaluating Datas
---- Data 0 Total Cells 34755 - Cells per Line 4965
-- Evaluating Indicators
---- Indicator 1.0 Average Total Cells 30 - Cells per line 30
---- SubIndicators Total Cells 1
---- Indicator 1.1 _LineDelay Total Cells 1 - Cells per line 1
---- SubIndicators Total Cells 1
...
---- Indicator 0.5 TestInd Total Cells 9930 - Cells per line 4965
---- SubIndicators Total Cells 0
-- Evaluating Observers
---- Observer 0 Total Cells 9930 - Cells per Line 4965
---- Observer 1 Total Cells 9930 - Cells per Line 4965
---- Observer 2 Total Cells 9930 - Cells per Line 4965
Total memory cells used: 184623
相同的,但启用最大节省(1):
$ ./memory-savings.py --save 1 --lendetails
-- Evaluating Datas
---- Data 0 Total Cells 266 - Cells per Line 38
-- Evaluating Indicators
---- Indicator 1.0 Average Total Cells 30 - Cells per line 30
---- SubIndicators Total Cells 1
...
---- Indicator 0.5 TestInd Total Cells 2 - Cells per line 1
---- SubIndicators Total Cells 0
-- Evaluating Observers
---- Observer 0 Total Cells 2 - Cells per Line 1
---- Observer 1 Total Cells 2 - Cells per Line 1
---- Observer 2 Total Cells 2 - Cells per Line 1
第二个输出立即显示数据源中的线已被限制为38个内存位置,而不是4965个(完整数据源长度)。
并且在可能的情况下,指标和观察者已被限制为1个,如输出的最后几行所示。
脚本代码和使用#
在backtrader的源代码中提供了示例。使用方法:
$ ./memory-savings.py --help
usage: memory-savings.py [-h] [--data DATA] [--save SAVE] [--datalines]
                         [--lendetails] [--plot]

Check Memory Savings

optional arguments:
  -h, --help    show this help message and exit
  --data DATA   Data to be read in (default: ../../datas/yhoo-1996-2015.txt)
  --save SAVE   Memory saving level [1, 0, -1, -2] (default: 0)
  --datalines   Print data lines (default: False)
  --lendetails  Print individual items memory usage (default: False)
  --plot        Plot the result (default: False)
代码:
from __future__ import (absolute_import

, division, print_function,
                        unicode_literals)

import argparse
import sys

import backtrader as bt
import backtrader.feeds as btfeeds
import backtrader.indicators as btind
import backtrader.utils.flushfile


class TestInd(bt.Indicator):
    lines = ('a', 'b')

    def __init__(self):
        self.lines.a = b = self.data.close - self.data.high
        self.lines.b = btind.SMA(b, period=20)


class St(bt.Strategy):
    params = (
        ('datalines', False),
        ('lendetails', False),
    )

    def __init__(self):
        btind.SMA()
        btind.Stochastic()
        btind.RSI()
        btind.MACD()
        btind.CCI()
        TestInd().plotinfo.plot = False

    def next(self):
        if self.p.datalines:
            txt = ','.join(
                ['%04d' % len(self),
                 '%04d' % len(self.data0),
                 self.data.datetime.date(0).isoformat()]
            )

            print(txt)

    def loglendetails(self, msg):
        if self.p.lendetails:
            print(msg)

    def stop(self):
        super(St, self).stop()

        tlen = 0
        self.loglendetails('-- Evaluating Datas')
        for i, data in enumerate(self.datas):
            tdata = 0
            for line in data.lines:
                tdata += len(line.array)
                tline = len(line.array)

            tlen += tdata
            logtxt = '---- Data {} Total Cells {} - Cells per Line {}'
            self.loglendetails(logtxt.format(i, tdata, tline))

        self.loglendetails('-- Evaluating Indicators')
        for i, ind in enumerate(self.getindicators()):
            tlen += self.rindicator(ind, i, 0)

        self.loglendetails('-- Evaluating Observers')
        for i, obs in enumerate(self.getobservers()):
            tobs = 0
            for line in obs.lines:
                tobs += len(line.array)
                tline = len(line.array)

            tlen += tdata
            logtxt = '---- Observer {} Total Cells {} - Cells per Line {}'
            self.loglendetails(logtxt.format(i, tobs, tline))

        print('Total memory cells used: {}'.format(tlen))

    def rindicator(self, ind, i, deep):
        tind = 0
        for line in ind.lines:
            tind += len(line.array)
            tline = len(line.array)

        thisind = tind

        tsub = 0
        for j, sind in enumerate(ind.getindicators()):
            tsub += self.rindicator(sind, j, deep + 1)

        iname = ind.__class__.__name__.split('.')[-1]

        logtxt = '---- Indicator {}.{} {} Total Cells {} - Cells per line {}'
        self.loglendetails(logtxt.format(deep, i, iname, tind, tline))
        logtxt = '---- SubIndicators Total Cells {}'
        self.loglendetails(logtxt.format(deep, i, iname, tsub))

        return tind + tsub


def runstrat():
    args = parse_args()

    cerebro = bt.Cerebro()
    data = btfeeds.YahooFinanceCSVData(dataname=args.data)
    cerebro.adddata(data)
    cerebro.addstrategy(
        St, datalines=args.datalines, lendetails=args.lendetails)

    cerebro.run(runonce=False, exactbars=args.save)
    if args.plot:
        cerebro.plot(style='bar')


def parse_args():
    parser = argparse.ArgumentParser(
        formatter_class=argparse.ArgumentDefaultsHelpFormatter,
        description='Check Memory Savings')

    parser.add_argument('--data', required=False,
                        default='../../datas/yhoo-1996-2015.txt',
                        help='Data to be read in')

    parser.add_argument('--save', required=False, type=int, default=0,
                        help=('Memory saving level [1, 0, -1, -2]'))

    parser.add_argument('--datalines', required=False, action='store_true',
                        help=('Print data lines'))

    parser.add_argument('--lendetails', required=False, action='store_true',
                        help=('Print individual items memory usage'))

    parser.add_argument('--plot', required=False, action='store_true',
                        help=('Plot the result'))

    return parser.parse_args()


if __name__ == '__main__':
    runstrat()